

Turn Foot Traffic into Market Intelligence
Anticipate market movements, spot consumer trends, and validate market assumptions with ground truth from real-world mobility data.

Trusted by Leaders in Adtech,
Enterprise, GIS, and Research



Alternative Data That Drives Alpha
See what's happening on the ground before it shows up in quarterly reports.


Monitor foot traffic to retail locations, restaurants, and venues. Detect trends weeks before earnings calls. Cover 300M devices across 4M+ POIs daily.
Track real-world KPIs for portfolio companies. Store performance, expansion success, competitive dynamics—all updated daily, not quarterly.
Validate market entry strategies with actual movement patterns. Understand demographics, traffic flows, and competitive landscapes before committing capital.
Privacy Is Paramount
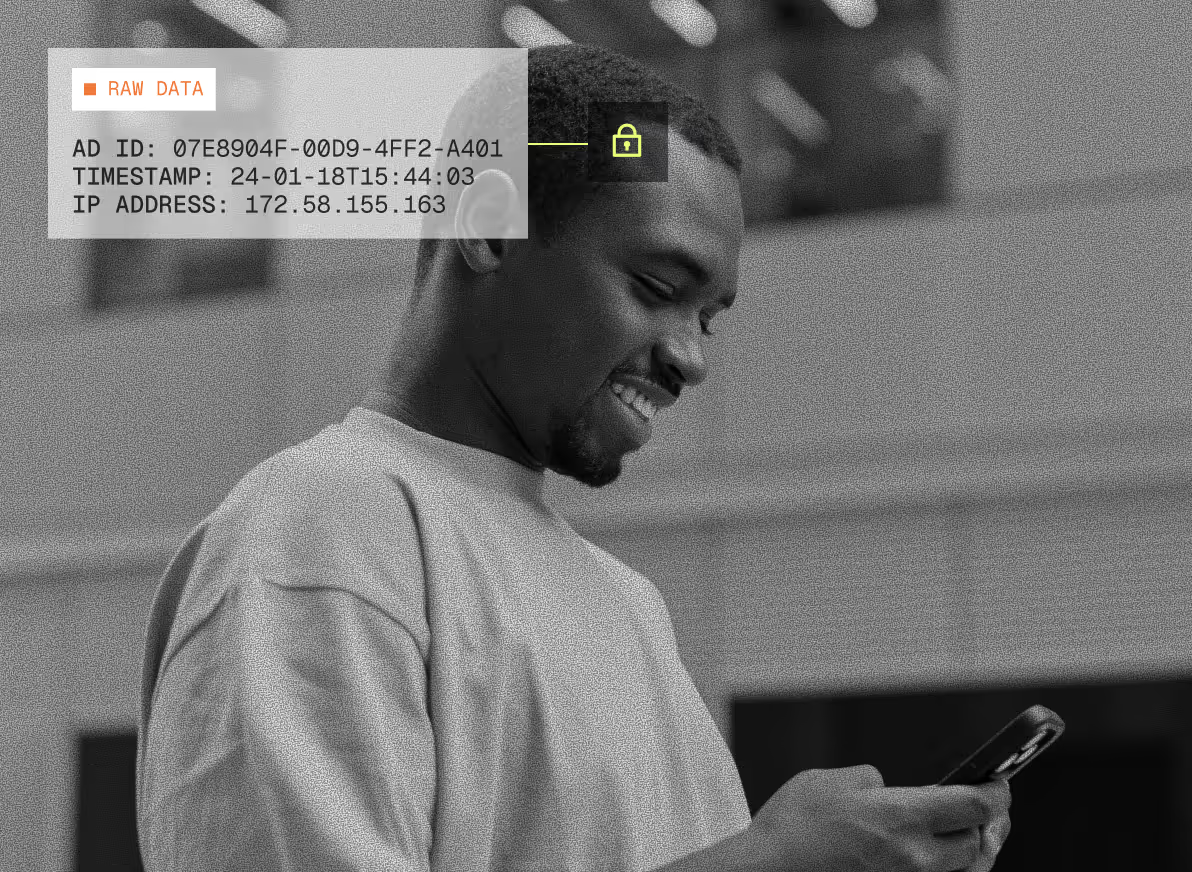
Every data point in our platform is pseudonymized, consent-based, and fully compliant with GDPR, CCPA, and global privacy regulations. Our privacy-first architecture ensures you can scale confidently, knowing that consumer privacy and regulatory compliance are built into every delivery.
Learn. Explore. Innovate.
Get the latest insights, product updates, and technical documentation.

Many providers offer mobility data through one or more delivery methods, including flat files, APIs, platforms. While the underlying data may be similar, the way you access and use that data can have a significant impact on your success.
As mobility data becomes increasingly important for marketers, researchers, cities, and technology companies, one question continues to surface: what's the best way to access and work with mobility data?
Organizations often spend significant time evaluating data quality, coverage, and privacy practices, but the way mobility data is delivered can be just as important. Whether you're building AI-powered products, conducting market research, analyzing consumer behavior, or creating audience intelligence, the right workflow can significantly impact implementation time, technical resources, scalability, and speed to insight.
Many providers offer mobility data through one or more delivery methods, including flat files, APIs, platforms. While the underlying data may be similar, the way you access and use that data can have a significant impact on your success.
The right choice depends on your team's approach, resources, workflows, and goals.
What Is Mobility Data?
Mobility data is anonymized location data that helps organizations understand how people move through the physical world. Businesses use mobility data to analyze visitation trends, measure consumer behavior, create audiences, conduct market research, evaluate site selection opportunities, and power location-based analytics.
The value of mobility data isn't just in the data itself, it's in how efficiently your organization can turn that data into actionable insights. That's where choosing the right delivery method becomes critical.
Understanding the Three Approaches
At a high level, mobility data is typically delivered in one of three ways:
- Flat Files provide direct access to raw datasets.
- APIs allow applications and systems to retrieve data automatically.
- Platforms provide a user interface for exploring, analyzing, and activating data.
Each option serves a different purpose and is designed for different types of users.
Flat Files: Maximum Flexibility and Control
Flat files are one of the most common ways to deliver mobility data. Rather than querying data through an interface or application, organizations receive large datasets directly, often through cloud storage or batch delivery.
This approach gives teams complete control over how data is processed, analyzed, and integrated into existing workflows.
For organizations with technical and engineering teams building proprietary models or combining mobility data with CRM, transaction, demographic, or first-party datasets, flat files often provide the greatest analytical flexibility.
Best For
- Data science teams
- Analytics teams
- Organizations with established data infrastructure
- Custom modeling and research projects
- Machine learning and AI workflows
- Historical analysis at scale
Advantages
- Access to large-scale raw datasets
- Maximum flexibility and control for analysis
- Ability to build custom models and workflows
- Easy integration with existing data lakes and warehouses
Considerations
- Requires technical expertise
- Longer implementation timelines
- Ongoing data management and maintenance
- Business users may not be able to access insights directly
While flat files offer unmatched flexibility, they also require organizations to manage storage, processing, infrastructure, and governance internally. For teams with strong data engineering capabilities, this tradeoff is often worthwhile.
APIs: Connecting Mobility Data to Applications and Workflows
APIs provide programmatic access to mobility data, allowing applications, dashboards, and internal systems to retrieve information as needed.
Instead of managing large datasets directly, developers can request narrower sets of data through API calls and integrate mobility intelligence into existing products or workflows.
APIs are particularly valuable when mobility data needs to power customer-facing applications, AI recommendations, automated reporting, audience enrichment, or location intelligence features within existing software.
Best For
- Product teams
- Developers
- Automated workflows
- Applications that require regular data updates
- Embedded analytics
- Customer-facing products
Advantages
- Faster implementation than managing large datasets
- Real-time or near real-time access to information
- Easy integration into applications and dashboards
- Supports automation and scalability
Considerations
- Requires development resources
- Query limits or usage constraints may apply
- Less flexibility than direct access to raw data
- Analysis still typically requires technical expertise
APIs are often the preferred choice when mobility data needs to become part of a larger technology stack or customer-facing application. Examples include powering retail site selection tools, enhancing media planning platforms, enriching audience intelligence solutions, generating AI-driven recommendations, or automatically updating dashboards with the latest visitation trends.
Platforms: The Fastest Path to Insights
Self-service platforms, such as Veraset’s Orchestrator, are designed to make mobility data accessible to analysts, marketers, planners, and business users without requiring extensive technical resources.
Instead of building infrastructure or writing code, users can explore data, analyze movement patterns, create audiences, and generate insights through an interface.
Rather than waiting on engineering resources, business users can answer questions themselves — from understanding visitation trends and trade areas to creating audience cohorts and exporting data for activation.
Best For
- Marketing teams
- Media planners
- Analysts
- Business users
- Organizations looking for faster time-to-value
Advantages
- Faster access to insights
- Minimal technical requirements and reduced dependence on engineering teams
- Built-in analysis and visualization tools
- Repeatable workflows and reports
- Audience tools (in the case of Orchestrator)
- Ability to explore POIs, polygons, movement trends, home/work locations, and audience segments without writing code
Considerations
- Less customizable than raw datasets
- Advanced/custom modeling may still require direct data access
- Platform capabilities vary by provider
For many organizations, platforms significantly reduce the time required to move from data access to actionable insights.
Which Option Is Right for Your Team?
The best delivery method often depends less on the data itself and more on who will be using it.
Choose Flat Files if:
- You have a data science or engineering team
- You need full access to raw mobility data
- You are building custom analytics models
- You want maximum control over processing and analysis
Choose APIs if:
- You need mobility data integrated into applications
- You want automated workflows
- You require ongoing programmatic access
- Your team has development resources available
Choose a Platform if:
- Speed and accessibility are priorities
- Business users need direct access to insights
- You want to reduce reliance on engineering resources
- Your goal is analysis, planning, or audience activation
Questions to Ask Before Choosing a Mobility Data Workflow
Before selecting a delivery method, consider these questions:
- What is your business goal?
- Who will primarily use the data: developers, analysts, or business users?
- Do you need raw data or ready-to-use insights?
- How much engineering support is available?
- Will mobility data power an application, internal analytics, or both?
- How frequently does the data need to be refreshed?
In many organizations, the answer isn't choosing one workflow over another. Different teams often benefit from different delivery methods depending on their objectives.
How Veraset Supports Every Mobility Data Workflow
Every organization approaches mobility data differently. Some require raw datasets for advanced analytics. Others need APIs for application development. Many simply want a faster way to explore and activate mobility insights.
We've found that organizations often evolve over time, starting with one workflow before expanding to others as mobility data becomes embedded across more teams and business functions.
That's why Veraset supports multiple ways to access mobility data.
Flat File Delivery: Access raw mobility data for custom analytics and modeling
API Access: Integrate mobility data into applications and workflows
Orchestrator: Explore, analyze, and activate mobility data through a self-service interface
There isn't a universally "best" way to access mobility data. The right choice depends on your technical resources, business goals, and how your teams want to work with location intelligence.
Whether you're building AI applications, conducting market research, powering audience intelligence, or helping business users make faster decisions, Veraset provides the flexibility to access mobility data in the way that best fits your workflow.

The surprising foot-traffic champion of the 2026 FIFA World Cup.
What movement data revealed about visitor behavior during the 2026 FIFA World Cup
The 2026 FIFA World Cup spent its opening weeks on US soil: eleven host cities; billions of eyes; sold-out stadiums from Seattle to Miami.
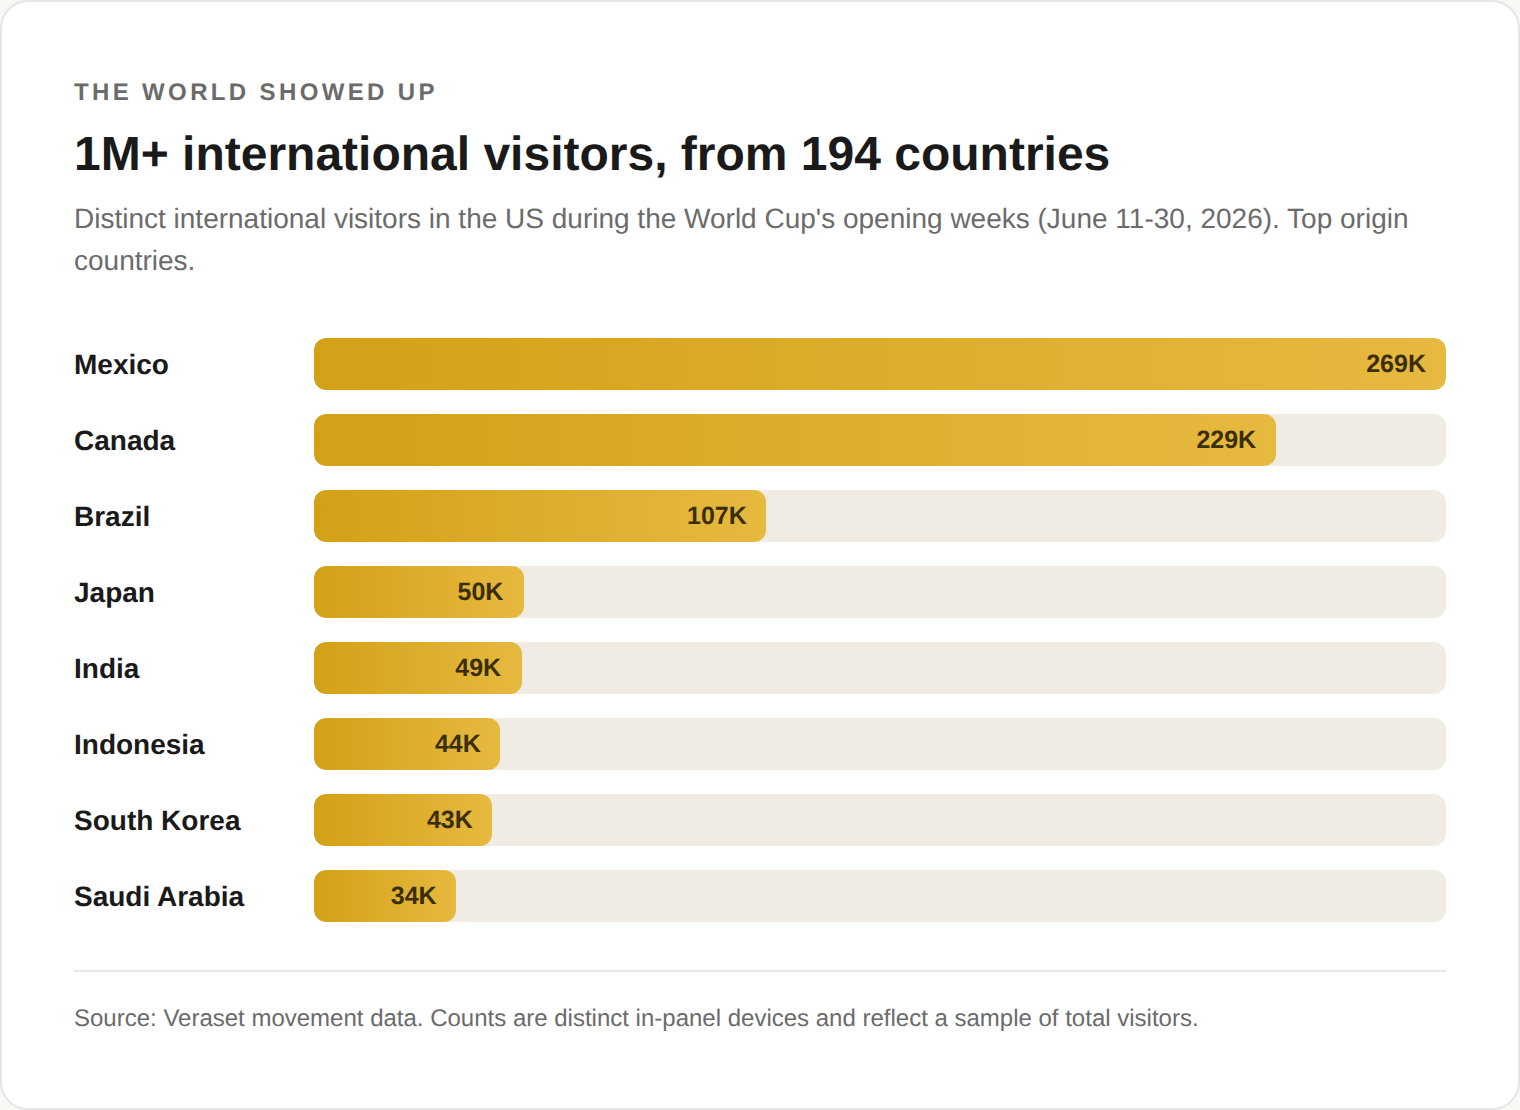
And by the numbers, the world really did show up: more than a million international visitors from 194 countries were in the US in the first three weeks alone, led by Mexico, Canada, and Brazil.
So when we went looking for the tournament's clearest fingerprint in America's foot-traffic data, we assumed the single spot (outside of a stadium) where we could see the on-the-ground impact of the World Cup would be a downtown fan zone or a stadium-adjacent street packed with bars.
But, no. It was a Waffle House, in Atlanta, a few miles away from the Mercedes-Benz stadium.
The internet saw it too
The data isn't the only place this showed up. Waffle House had a genuine viral moment during the tournament. A German fan posting as @FreddyLA7 documented his 1am first-ever Waffle House run ("great food, great prices, friendly staff, 10/10") and the post racked up millions of views, with Waffle House's own account chiming in to thank him. He wasn't alone: international fans across social media went wide-eyed over American institutions like Buc-ee's, Walmart, and, again and again, Waffle House.
Waffle House leaned all the way in. The downtown Atlanta location, a short walk from the FIFA Fan Festival, opened a pop-up shop selling Waffle House soccer jerseys and branded soccer balls, and fans from around the world lined up for a piece of it.
So when our data shows Waffle House traffic concentrating near the Atlanta stadium once matches began, it isn't measuring something invisible. It's the quantified version of a thing the internet was already buzzing about. The memes said "the fans found the Waffle House." The foot-traffic data says: yes, they did, here's exactly how much.
The one signal that popped
We pulled the foot-traffic data for all eleven host cities to find out.
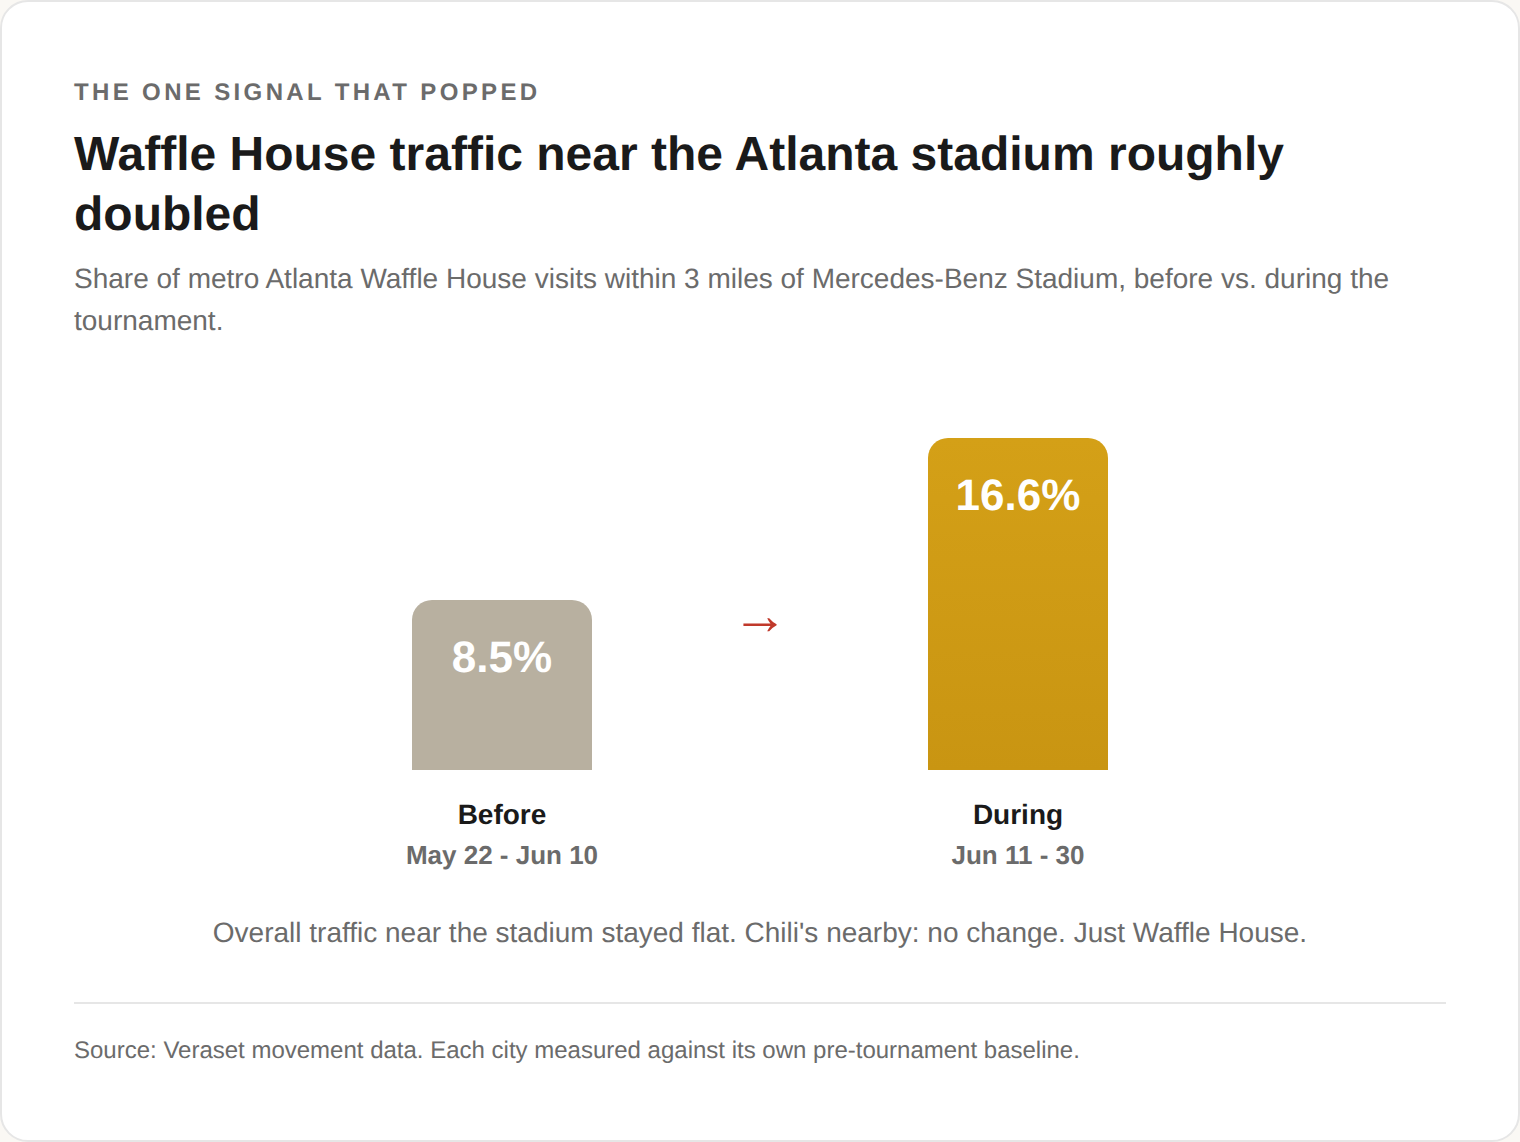
In Atlanta, around Mercedes-Benz Stadium, here's what surfaced. In the weeks before the tournament, about 8.5% of metro Atlanta's Waffle House visits happened within three miles of the stadium. Once the World Cup started, that jumped to 16.6%. The share of the city's Waffle House traffic clustering around the venue roughly doubled.
Now the part that makes it interesting
This wasn't just a correlation to a surge in visitors to Atlanta. We checked. Overall foot traffic near the stadium barely budged, the metro didn't surge, and the area around the venue didn't broadly fill up. And it wasn't chain restaurants in general: Chili's, three miles from the same stadium, showed no change.
It was Waffle House, specifically. And, once the matches started, specifically.
Which, if you think about it, tracks perfectly. A 24-hour, cash-friendly, no-pretense diner steps from a World Cup stadium is exactly where you end up after a match, whether you're a Buckhead local or you drove three hours for the game. The World Cup didn't flood Atlanta; it funneled a very particular crowd into a very particular institution.
Why a city-level headline would have missed this entirely
Ask "did the World Cup boost Atlanta?" and the honest answer is a shrug. City-wide, not measurably.
Ask "what happened inside a three-mile ring around the stadium, at one specific kind of place, once the whistle blew?" And there's your story.
Mega-events don't necessarily move cities in one big uniform wave. They move specific people to specific places at specific times, and most of that is invisible unless you can zoom all the way in. Foot-traffic data allows us to zoom in and understand movement patterns before, during, and after an event. In this case, it was Waffle House.
Methodology
We looked at foot traffic during the 2026 FIFA World Cup tournament's opening weeks (June 11–30) versus the weeks right before it, measuring visits within three miles of each host stadium as a share of total metro visits to the same chains (Chili's and Waffle House). Using each city as its own before-and-after control keeps the comparison honest and unaffected by shifts in data coverage over time. We ran it across all eleven US host cities and both chains. Atlanta Waffle House was the signal that stood up.
The rest of the host cities? Quiet. Which, honestly, is its own finding: the World Cup's footprint on American foot traffic was less a wave and more a very precise splash.
A note on the numbers: the international-visitor figure and the Waffle House figure come from two different datasets and describe two separate facts. Our data shows the world was here, and separately shows where Atlanta's Waffle House traffic went, it doesn't claim the visitors themselves were the ones ordering hash browns.
This is the kind of question movement data is built to answer: not "did something happen," but exactly where, exactly when, and exactly who showed up. Get in touch to explore what mobility data can reveal for you.

The 5 Biggest Mistakes Buyers Make When Evaluating Mobility Data, and How to Avoid Them
Choosing a mobility data provider isn't just about comparing datasets.
Whether you're building audiences, measuring campaign performance, selecting new retail locations, or powering research and AI models, the quality of your decisions depends on choosing the right data, and the right partner.
Yet many evaluation processes focus on the wrong criteria. Buyers compare scale, coverage, or pricing before they've clearly defined their use case or goals.
After years of working with agencies, retailers, researchers, and technology partners, we've seen the same evaluation mistakes surface time and again.
Here are five of the most common mistakes (and how to avoid them).
Mistake #1: Starting with the Data Instead of the Business Problem
One of the biggest mistakes buyers make is evaluating providers before they've clearly defined what they're trying to accomplish.
Different use cases require different strengths.
For example:
- Audience creation may prioritize scale and consistency.
- Retail site selection may depend on geographic precision and long-term visitation trends.
- Attribution requires reliable methodology and confidence in movement patterns.
- AI applications often demand flexible access to large, well-structured datasets.
Without first defining your objectives, it's easy to optimize for the wrong criteria — choosing a provider based on the largest dataset, the lowest price, or the longest feature list, rather than the one that's best suited to your specific use case.
Before evaluating vendors, ask yourself:
- What business question am I trying to answer or solve?
- Who will use this data, and how?
- What does success look like?
- Which capabilities are essential and which are nice to have?
Once that answer is clear, evaluating providers becomes much more straightforward. Instead of searching for the "best" mobility data provider, you'll be looking for the provider that's best equipped to help you achieve your goals.
Mistake #2: Assuming All Mobility Data Is Created Equal
Not all mobility data is collected, processed, or delivered in the same way, and those differences can have a meaningful impact on the insights you generate.
Providers may offer:
- Raw location observations
- Processed or modeled datasets
- Aggregated insights
- Specialized products built for specific workflows
None of these approaches is inherently better than another. The right choice depends on what you're trying to accomplish, who will be using the data, and how much flexibility or customization your team requires.
As you evaluate providers, consider questions like:
- How is the data collected and sourced?
- What processing or modeling has been applied?
- How frequently is the data refreshed?
- What quality assurance and validation processes are in place?
- Does the provider offer the data in a format that fits my workflow—whether that's raw data, APIs, or ready-to-use insights?
Understanding these differences will help ensure you're evaluating providers based on what matters most for your business, rather than assuming all mobility data delivers the same value.
Mistake #3: Confusing More Data with Better Data
Bigger is not always better. A larger dataset isn't valuable if it lacks the precision, consistency, or quality required for your application.
If you're building national audiences, training AI models, or conducting broad market analysis, having a large, representative dataset can be a significant advantage. In these scenarios, greater scale often translates into more robust insights and better statistical confidence.
But there are many cases where simply having more data won't improve your results.
For applications like visitation analysis, site selection, attribution, or localized market intelligence, factors such as precision, consistency, and data quality can be just as important — if not more so — than the total number of devices.
Instead of asking, "Who has the biggest dataset?" consider questions like:
- Is the dataset representative of the population I'm trying to understand?
- Is coverage consistent across the geographies that matter most to me?
- How is data quality monitored and maintained?
- How frequently is the data refreshed?
- Does the provider have the scale my specific use case requires?
The best mobility data provider for you is the one with the right combination of scale, quality, and consistency for your business objectives.
Mistake #4: Treating Privacy as a Checkbox
Privacy has become one of the most important considerations when evaluating mobility data, but it's about much more than checking a compliance box.
As regulations continue to evolve and consumer expectations around data transparency increase, organizations need confidence that the data they're using has been collected and managed responsibly. A provider's approach to privacy doesn't just impact legal compliance—it can also influence data quality, business continuity, and long-term trust.
When evaluating mobility data providers, ask questions such as:
- How is user consent obtained and respected?
- How is data collected and sourced?
- What governance and quality controls are in place?
- How does the provider adapt to changing privacy regulations?
- What processes exist to ensure responsible data stewardship over time?
The strongest providers view privacy as an ongoing commitment. They invest in transparent practices, continuously monitor the evolving regulatory landscape, and build privacy considerations into the way they collect, manage, and deliver data.
Ultimately, a thoughtful approach to privacy benefits everyone. It helps organizations reduce risk, maintain confidence in their data strategy, and build solutions that are sustainable as the industry continues to evolve.
Mistake #5: Assuming There's Only One Way to Access Mobility Data
One of the most overlooked aspects of evaluating a mobility data provider is how you'll actually access and use the data.
Organizations have different technical capabilities, workflows, and business needs. A data science team building custom models has very different requirements than a marketing team looking for audience insights or an analyst exploring visitation trends.
That's why the best providers offer multiple ways to work with their data.
For example, at Veraset, customers can choose the approach that best fits their organization:
- Flat Files for organizations that want direct access to raw data for custom analysis, modeling, and integration into their own environments.
- APIs for teams that need real-time or on-demand access to mobility data within existing applications and workflows.
- Self-Service Platform for business users who want to explore mobility insights, visualize trends, and answer questions without relying on engineering resources.
No single delivery method is inherently better than another. The right choice depends on your team's technical expertise, your existing technology stack, and the business problems you're trying to solve.
As you evaluate providers, consider questions like:
- Does this provider support the way my team prefers to work?
- Can different teams access the data in the ways they need?
- Will this delivery model scale as our use cases evolve?
- If our needs change, will we have to switch providers or simply use a different product?
The best mobility data partner isn't just one that delivers high-quality data. It's one that can deliver that data in the format that creates the most value for your organization today and as your business grows.
What Great Evaluations Have in Common
Successful buyers don't begin by comparing vendors; they begin by defining success. They ask thoughtful questions about their business objectives, data quality requirements, privacy expectations, and operational workflows before narrowing their list of providers.
That approach consistently leads to stronger partnerships and better business outcomes.
If you're evaluating mobility data providers, we'd be happy to help you think through the process. Whether you're comparing vendors, validating an existing solution, or exploring a new use case, our team can help you ask the right questions before making a decision.
Get in touch to discuss your use case.
Many providers offer mobility data through one or more delivery methods, including flat files, APIs, platforms. While the underlying data may be similar, the way you access and use that data can have a significant impact on your success.
As mobility data becomes increasingly important for marketers, researchers, cities, and technology companies, one question continues to surface: what's the best way to access and work with mobility data?
Organizations often spend significant time evaluating data quality, coverage, and privacy practices, but the way mobility data is delivered can be just as important. Whether you're building AI-powered products, conducting market research, analyzing consumer behavior, or creating audience intelligence, the right workflow can significantly impact implementation time, technical resources, scalability, and speed to insight.
Many providers offer mobility data through one or more delivery methods, including flat files, APIs, platforms. While the underlying data may be similar, the way you access and use that data can have a significant impact on your success.
The right choice depends on your team's approach, resources, workflows, and goals.
What Is Mobility Data?
Mobility data is anonymized location data that helps organizations understand how people move through the physical world. Businesses use mobility data to analyze visitation trends, measure consumer behavior, create audiences, conduct market research, evaluate site selection opportunities, and power location-based analytics.
The value of mobility data isn't just in the data itself, it's in how efficiently your organization can turn that data into actionable insights. That's where choosing the right delivery method becomes critical.
Understanding the Three Approaches
At a high level, mobility data is typically delivered in one of three ways:
- Flat Files provide direct access to raw datasets.
- APIs allow applications and systems to retrieve data automatically.
- Platforms provide a user interface for exploring, analyzing, and activating data.
Each option serves a different purpose and is designed for different types of users.
Flat Files: Maximum Flexibility and Control
Flat files are one of the most common ways to deliver mobility data. Rather than querying data through an interface or application, organizations receive large datasets directly, often through cloud storage or batch delivery.
This approach gives teams complete control over how data is processed, analyzed, and integrated into existing workflows.
For organizations with technical and engineering teams building proprietary models or combining mobility data with CRM, transaction, demographic, or first-party datasets, flat files often provide the greatest analytical flexibility.
Best For
- Data science teams
- Analytics teams
- Organizations with established data infrastructure
- Custom modeling and research projects
- Machine learning and AI workflows
- Historical analysis at scale
Advantages
- Access to large-scale raw datasets
- Maximum flexibility and control for analysis
- Ability to build custom models and workflows
- Easy integration with existing data lakes and warehouses
Considerations
- Requires technical expertise
- Longer implementation timelines
- Ongoing data management and maintenance
- Business users may not be able to access insights directly
While flat files offer unmatched flexibility, they also require organizations to manage storage, processing, infrastructure, and governance internally. For teams with strong data engineering capabilities, this tradeoff is often worthwhile.
APIs: Connecting Mobility Data to Applications and Workflows
APIs provide programmatic access to mobility data, allowing applications, dashboards, and internal systems to retrieve information as needed.
Instead of managing large datasets directly, developers can request narrower sets of data through API calls and integrate mobility intelligence into existing products or workflows.
APIs are particularly valuable when mobility data needs to power customer-facing applications, AI recommendations, automated reporting, audience enrichment, or location intelligence features within existing software.
Best For
- Product teams
- Developers
- Automated workflows
- Applications that require regular data updates
- Embedded analytics
- Customer-facing products
Advantages
- Faster implementation than managing large datasets
- Real-time or near real-time access to information
- Easy integration into applications and dashboards
- Supports automation and scalability
Considerations
- Requires development resources
- Query limits or usage constraints may apply
- Less flexibility than direct access to raw data
- Analysis still typically requires technical expertise
APIs are often the preferred choice when mobility data needs to become part of a larger technology stack or customer-facing application. Examples include powering retail site selection tools, enhancing media planning platforms, enriching audience intelligence solutions, generating AI-driven recommendations, or automatically updating dashboards with the latest visitation trends.
Platforms: The Fastest Path to Insights
Self-service platforms, such as Veraset’s Orchestrator, are designed to make mobility data accessible to analysts, marketers, planners, and business users without requiring extensive technical resources.
Instead of building infrastructure or writing code, users can explore data, analyze movement patterns, create audiences, and generate insights through an interface.
Rather than waiting on engineering resources, business users can answer questions themselves — from understanding visitation trends and trade areas to creating audience cohorts and exporting data for activation.
Best For
- Marketing teams
- Media planners
- Analysts
- Business users
- Organizations looking for faster time-to-value
Advantages
- Faster access to insights
- Minimal technical requirements and reduced dependence on engineering teams
- Built-in analysis and visualization tools
- Repeatable workflows and reports
- Audience tools (in the case of Orchestrator)
- Ability to explore POIs, polygons, movement trends, home/work locations, and audience segments without writing code
Considerations
- Less customizable than raw datasets
- Advanced/custom modeling may still require direct data access
- Platform capabilities vary by provider
For many organizations, platforms significantly reduce the time required to move from data access to actionable insights.
Which Option Is Right for Your Team?
The best delivery method often depends less on the data itself and more on who will be using it.
Choose Flat Files if:
- You have a data science or engineering team
- You need full access to raw mobility data
- You are building custom analytics models
- You want maximum control over processing and analysis
Choose APIs if:
- You need mobility data integrated into applications
- You want automated workflows
- You require ongoing programmatic access
- Your team has development resources available
Choose a Platform if:
- Speed and accessibility are priorities
- Business users need direct access to insights
- You want to reduce reliance on engineering resources
- Your goal is analysis, planning, or audience activation
Questions to Ask Before Choosing a Mobility Data Workflow
Before selecting a delivery method, consider these questions:
- What is your business goal?
- Who will primarily use the data: developers, analysts, or business users?
- Do you need raw data or ready-to-use insights?
- How much engineering support is available?
- Will mobility data power an application, internal analytics, or both?
- How frequently does the data need to be refreshed?
In many organizations, the answer isn't choosing one workflow over another. Different teams often benefit from different delivery methods depending on their objectives.
How Veraset Supports Every Mobility Data Workflow
Every organization approaches mobility data differently. Some require raw datasets for advanced analytics. Others need APIs for application development. Many simply want a faster way to explore and activate mobility insights.
We've found that organizations often evolve over time, starting with one workflow before expanding to others as mobility data becomes embedded across more teams and business functions.
That's why Veraset supports multiple ways to access mobility data.
Flat File Delivery: Access raw mobility data for custom analytics and modeling
API Access: Integrate mobility data into applications and workflows
Orchestrator: Explore, analyze, and activate mobility data through a self-service interface
There isn't a universally "best" way to access mobility data. The right choice depends on your technical resources, business goals, and how your teams want to work with location intelligence.
Whether you're building AI applications, conducting market research, powering audience intelligence, or helping business users make faster decisions, Veraset provides the flexibility to access mobility data in the way that best fits your workflow.
.svg)
New platform enables teams to turn large-scale mobility datasets into insights, audiences and action.
Veraset Launches Orchestrator, a Self-Serve Platform for Scalable Mobility Intelligence
ALEXANDRIA, VA — March 24, 2026 — Veraset, a global provider of privacy-safe mobility data, today announced the launch of Orchestrator, a self-serve platform that enables organizations to transform mobility data into repeatable workflows, insights, and audiences without complex engineering or manual data pulls.
As demand for real-world behavioral insights grows across industries — from advertising and retail to real estate and urban planning — organizations increasingly rely on mobility data to understand how people move, visit locations, and interact with physical environments. Yet working with mobility data often requires engineering resources, manual scripts, and custom data extracts that limit accessibility for many organizations.
Orchestrator simplifies that process by giving analysts, marketing and data teams direct, self-serve access to mobility intelligence.
“With Orchestrator, we’re putting the power of mobility data directly in the hands of the people who need it,” said Geoffrey Prince, CEO of Veraset. “Teams can explore location intelligence, analyze behavior, and move from insight to activation far faster than traditional data workflows allow.”
Using Orchestrator, organizations can define locations and points of interest, extract mobility data across flexible geographies and timeframes, analyze visitation and movement patterns, and transform those insights into datasets or audience cohorts for research, measurement, or activation.
The platform enables teams to build automated workflows that replace one-off data pulls with repeatable processes. Users can schedule recurring queries and reports, analyze results through maps and dashboards, and export compliant datasets or audiences for downstream analytics and advertising platforms.
Orchestrator is designed to support a wide range of use cases, including foot traffic analysis, market planning, measurement and performance analysis, audience insights, site selection, advanced research, platform enrichment, and more.
The launch of Orchestrator expands how organizations can access Veraset’s mobility data. In addition to the self-serve platform, Veraset continues to provide mobility datasets via flat file delivery for large-scale data processing and API access for automated querying and integration into existing products or workflows.
Veraset’s mobility intelligence is built on more than 10 billion daily location observations across over 200 countries, providing global coverage and device-level precision. The company’s datasets, including movement, visits, home and work insights, and trips, are trusted by organizations across advertising, technology, consulting, real estate, retail, education, and municipalities to understand real-world behavior at scale.
Orchestrator is available today to Veraset customers. Click here to learn more.
About Veraset
Veraset transforms real-world movement into trusted mobility intelligence. Its privacy-first, responsibly sourced data spans 200+ countries and powers critical use cases including market planning, measurement and performance analysis, audience and visitation insights, site selection, advanced research, platform enrichment, and more.
From raw location signals to structured journey insights, delivered via direct data access, API, or self-serve tools, Veraset provides the reliable foundation teams need to move faster, go deeper, and build smarter solutions. Learn more at www.veraset.com

See how Veraset ensures top-tier data security and privacy through encryption and partner protection.
In an era where data breaches and privacy concerns dominate headlines, safeguarding sensitive information has never been more critical.
At Veraset, we take data security, privacy, and partner protection seriously. Recent high-profile breaches in the industry have underscored the importance of robust security measures.
In the article below, we outline the key protocols we’ve implemented to ensure the highest standards of data protection and maintain the trust of our clients and partners.
Minimizing Risk
At Veraset, we’ve built our systems with security as a top priority. Here’s how we protect our infrastructure and operations:
- No Marketplaces: Unlike some data providers, Veraset does not distribute data through third-party marketplaces. This ensures that data is only accessible directly through our secure systems, minimizing the risk of unauthorized access or exposure.
- Server-to-Server Connections: All data delivery is conducted exclusively through server-to-server connections. This means data is pushed directly from our environment to our clients’ environments, eliminating any public exposure or intermediaries in the exchange. All data transfers utilize up-to-date, secure protocols and that systems are regularly audited for potential vulnerabilities.
- Role-Based Access Control (RBAC): Access to sensitive systems, such as AWS, is provisioned through Okta. This allows us to grant specific roles to users, ensuring that only authorized personnel can access the resources they need. With fine-grained control over permissions, we maintain a secure and efficient workflow.
Protecting Our Data
We go above and beyond to ensure that the data we handle is protected at every stage of its lifecycle. Here’s how we do it:
- Veraset Anonymous Identifiers (VAIDR): Our pipeline uses pseudonymized identifiers that cannot be reverse-engineered. This means that even if someone were to access a VAIDIR, they wouldn’t be able to trace it back to an individual.
- Data Segregation: Personally identifiable information (PII) is stored separately from other data types, such as location, demographic, and device data. These datasets are only brought together at the point of delivery, reducing the risk of exposure.
- Encryption and Regular Testing: All data is encrypted during transit, and we conduct penetration testing every six to twelve months to identify and address potential vulnerabilities. These proactive measures ensure that our systems remain secure against evolving threats.
- Code Reviews: Any data provisioning requires a code review and approval by a second developer. This two-step process prevents unauthorized access and ensures accountability.
Protecting Our Partners: Safeguarding Identities and Access
We understand that our partners rely on us to protect their interests as well. Here’s how we ensure their security:
- Supplier Anonymization: Suppliers are identified by unique codes rather than names, protecting their identities from exposure and maintaining their anonymity.
- Controlled Access: When we expose a data bucket to a partner, access is provisioned to a specific user within their organization. This minimizes the risk of exposure, as a breach would require compromising that user’s credentials.
- Use Case Vetting: Before proceeding with data evaluation, all prospects must state their intended use case, which is reviewed and approved by our team. This ensures that data is only used for legitimate and authorized purposes.
Key Takeaways for Clients
When you partner with Veraset, you can trust that your data is in safe hands. In sum, what sets us apart is:
- Direct and Secure Data Delivery: Our server-to-server connections ensure minimal exposure risk.
- Advanced Data Protection: Sensitive data is pseudonymized, segregated, and encrypted for maximum security.
- Partner Safeguards: We protect the identities of our partners and suppliers through anonymization and controlled access.
- Proactive Security Measures: Regular testing and robust access controls prevent unauthorized data access.
We’re committed to maintaining the highest standards of data security and privacy. By implementing these measures, we not only protect our data but also uphold the trust and confidence of our clients and partners.
---
Stay secure. Stay confident. Partner with Veraset.
For more information about our data security practices, contact us today.
The surprising foot-traffic champion of the 2026 FIFA World Cup.
What movement data revealed about visitor behavior during the 2026 FIFA World Cup
The 2026 FIFA World Cup spent its opening weeks on US soil: eleven host cities; billions of eyes; sold-out stadiums from Seattle to Miami.
And by the numbers, the world really did show up: more than a million international visitors from 194 countries were in the US in the first three weeks alone, led by Mexico, Canada, and Brazil.
So when we went looking for the tournament's clearest fingerprint in America's foot-traffic data, we assumed the single spot (outside of a stadium) where we could see the on-the-ground impact of the World Cup would be a downtown fan zone or a stadium-adjacent street packed with bars.
But, no. It was a Waffle House, in Atlanta, a few miles away from the Mercedes-Benz stadium.
The internet saw it too
The data isn't the only place this showed up. Waffle House had a genuine viral moment during the tournament. A German fan posting as @FreddyLA7 documented his 1am first-ever Waffle House run ("great food, great prices, friendly staff, 10/10") and the post racked up millions of views, with Waffle House's own account chiming in to thank him. He wasn't alone: international fans across social media went wide-eyed over American institutions like Buc-ee's, Walmart, and, again and again, Waffle House.
Waffle House leaned all the way in. The downtown Atlanta location, a short walk from the FIFA Fan Festival, opened a pop-up shop selling Waffle House soccer jerseys and branded soccer balls, and fans from around the world lined up for a piece of it.
So when our data shows Waffle House traffic concentrating near the Atlanta stadium once matches began, it isn't measuring something invisible. It's the quantified version of a thing the internet was already buzzing about. The memes said "the fans found the Waffle House." The foot-traffic data says: yes, they did, here's exactly how much.
The one signal that popped
We pulled the foot-traffic data for all eleven host cities to find out.
In Atlanta, around Mercedes-Benz Stadium, here's what surfaced. In the weeks before the tournament, about 8.5% of metro Atlanta's Waffle House visits happened within three miles of the stadium. Once the World Cup started, that jumped to 16.6%. The share of the city's Waffle House traffic clustering around the venue roughly doubled.
Now the part that makes it interesting
This wasn't just a correlation to a surge in visitors to Atlanta. We checked. Overall foot traffic near the stadium barely budged, the metro didn't surge, and the area around the venue didn't broadly fill up. And it wasn't chain restaurants in general: Chili's, three miles from the same stadium, showed no change.
It was Waffle House, specifically. And, once the matches started, specifically.
Which, if you think about it, tracks perfectly. A 24-hour, cash-friendly, no-pretense diner steps from a World Cup stadium is exactly where you end up after a match, whether you're a Buckhead local or you drove three hours for the game. The World Cup didn't flood Atlanta; it funneled a very particular crowd into a very particular institution.
Why a city-level headline would have missed this entirely
Ask "did the World Cup boost Atlanta?" and the honest answer is a shrug. City-wide, not measurably.
Ask "what happened inside a three-mile ring around the stadium, at one specific kind of place, once the whistle blew?" And there's your story.
Mega-events don't necessarily move cities in one big uniform wave. They move specific people to specific places at specific times, and most of that is invisible unless you can zoom all the way in. Foot-traffic data allows us to zoom in and understand movement patterns before, during, and after an event. In this case, it was Waffle House.
Methodology
We looked at foot traffic during the 2026 FIFA World Cup tournament's opening weeks (June 11–30) versus the weeks right before it, measuring visits within three miles of each host stadium as a share of total metro visits to the same chains (Chili's and Waffle House). Using each city as its own before-and-after control keeps the comparison honest and unaffected by shifts in data coverage over time. We ran it across all eleven US host cities and both chains. Atlanta Waffle House was the signal that stood up.
The rest of the host cities? Quiet. Which, honestly, is its own finding: the World Cup's footprint on American foot traffic was less a wave and more a very precise splash.
A note on the numbers: the international-visitor figure and the Waffle House figure come from two different datasets and describe two separate facts. Our data shows the world was here, and separately shows where Atlanta's Waffle House traffic went, it doesn't claim the visitors themselves were the ones ordering hash browns.
This is the kind of question movement data is built to answer: not "did something happen," but exactly where, exactly when, and exactly who showed up. Get in touch to explore what mobility data can reveal for you.

The FTC is intensifying its oversight of sensitive location data, enforcing stricter transparency, consent, and privacy standards across the data ecosystem.
The Federal Trade Commission (FTC) has recently intensified its focus on the protection of sensitive location data, marking a significant shift in its regulatory approach. This heightened scrutiny is evident through a series of enforcement actions against data brokers and companies involved in the collection, processing, and sale of location data. These actions underscore the FTC's commitment to safeguarding consumer privacy and ensuring that companies adhere to transparent and ethical data practices.
X-Mode Social and Outlogic
On January 9, 2024, the FTC issued its first-ever prohibition on the use, sale, and disclosure of sensitive location data against X-Mode Social and Outlogic (collectively referred to as "X-Mode"). This landmark action was driven by allegations that X-Mode engaged in unfair and deceptive practices by misrepresenting the use of location data and failing to obtain proper consumer consent. The FTC's complaint highlighted several critical issues:
- Inadequate Disclosure of Use and Purpose: X-Mode's privacy disclosures were found to be insufficient, failing to inform consumers about the full extent of data usage, including the sale of location data to government entities. This lack of transparency prevented consumers from making informed decisions about their data.
- Inadequate Protections for Sensitive Data: Until May 2023, X-Mode did not restrict the collection of location data from sensitive locations such as healthcare facilities, churches, and schools. The company lacked policies to remove sensitive locations from raw data before selling it, raising significant privacy concerns.
- Failure to Honor Consumer Privacy Choices: X-Mode was criticized for not respecting consumer privacy preferences, particularly in cases where users had opted out of data collection.
The FTC's order against X-Mode mandated the implementation of an SDK Supplier Assessment Program to ensure that third-party apps using X-Mode's software development kits (SDKs) obtained proper consumer consent and adhered to privacy standards.
InMarket Media
Shortly after the action against X-Mode, the FTC announced a similar enforcement action against InMarket Media on January 18, 2024. The case against InMarket emphasized the need for transparency, proper notice, and consumer consent regarding the processing of sensitive location data. Key issues identified in the complaint included:
- Lack of Consumer Notification: InMarket failed to notify consumers that their location data was being used for targeted advertising. The consent screens within apps only mentioned that location data would be used for app functionality, omitting details about precise location tracking and its commercial use.
- Excessive Data Retention: InMarket's five-year retention period for location data was deemed excessively long, increasing the risk of data misuse or re-identification.
The FTC's order against InMarket prohibited the company from sharing, selling, or transferring sensitive location data without explicit consumer consent.
Broader Implications and Industry Impact
The FTC's recent actions against X-Mode and InMarket are part of a broader effort to address the growing concerns over the use of personal data in advertising and other commercial activities. These cases highlight several critical themes that are likely to shape future regulatory actions:
- Transparency and Consumer Consent. One of the central issues in both the X-Mode and InMarket cases was the lack of transparency and inadequate consumer consent. The FTC has made it clear that companies must provide clear and conspicuous privacy disclosures that accurately describe how consumer data will be used. Vaguely worded consent forms or disclosures that omit critical information are insufficient and can lead to enforcement actions.
- Protection of Sensitive Data. The FTC has emphasized that certain types of data, such as location data, are inherently sensitive and require robust protections. This sensitivity is due to the potential for such data to reveal intimate details about a person's life, such as visits to medical facilities, places of worship, or other sensitive locations. The FTC's actions signal that the sale or misuse of such data without proper safeguards is unacceptable.
- Data Minimization and Retention Policies. The FTC has also focused on the principles of data minimization and appropriate data retention periods. Companies are encouraged to collect only the data necessary for their operations and to retain it for the shortest time possible. Long retention periods increase the risk of data breaches and misuse, and the FTC is likely to scrutinize such practices closely.
- Future Directions and Regulatory Trends. The FTC's recent enforcement actions are indicative of a broader regulatory trend towards stricter oversight of data practices. Several key themes and potential future directions can be identified:
- Increased Enforcement and Penalties. The FTC has signaled its intention to continue aggressive enforcement actions against companies that violate consumer privacy. This includes not only fines and penalties but also more stringent measures such as outright bans on certain data practices, as seen in the cases against X-Mode and InMarket.
- Focus on Upstream Liability. FTC Chair Lina Khan has emphasized the importance of addressing upstream liability, targeting not just the consumer-facing applications but also the backend infrastructure that facilitates data collection and processing. This approach aims to hold all actors in the data ecosystem accountable for their roles in enabling unlawful conduct.
- Algorithmic Disgorgement. The FTC has increasingly used the tool of algorithmic disgorgement, requiring companies to delete not only unlawfully obtained data but also the data products created from such data. This measure aims to address the incentives that drive harmful data practices and ensure that companies do not benefit from their unlawful actions.
- Comprehensive Privacy Legislation. There is growing support within the FTC for comprehensive privacy legislation that would provide baseline protections for all consumers. Such legislation could help address the challenges posed by new technologies and business models that rely on extensive data collection.
Summing up
The FTC's recent enforcement actions against X-Mode Social, Outlogic, and InMarket Media represent a significant step towards stronger protection of sensitive location data. These actions highlight the importance of transparency, consumer consent, and robust data protection measures.
As the data economy continues to evolve, the FTC's regulatory approach is likely to become increasingly critical in ensuring that consumer privacy is respected and protected. Companies operating in this space must heed the lessons from these enforcement actions and adopt best practices to avoid similar scrutiny in the future.
The 5 Biggest Mistakes Buyers Make When Evaluating Mobility Data, and How to Avoid Them
Choosing a mobility data provider isn't just about comparing datasets.
Whether you're building audiences, measuring campaign performance, selecting new retail locations, or powering research and AI models, the quality of your decisions depends on choosing the right data, and the right partner.
Yet many evaluation processes focus on the wrong criteria. Buyers compare scale, coverage, or pricing before they've clearly defined their use case or goals.
After years of working with agencies, retailers, researchers, and technology partners, we've seen the same evaluation mistakes surface time and again.
Here are five of the most common mistakes (and how to avoid them).
Mistake #1: Starting with the Data Instead of the Business Problem
One of the biggest mistakes buyers make is evaluating providers before they've clearly defined what they're trying to accomplish.
Different use cases require different strengths.
For example:
- Audience creation may prioritize scale and consistency.
- Retail site selection may depend on geographic precision and long-term visitation trends.
- Attribution requires reliable methodology and confidence in movement patterns.
- AI applications often demand flexible access to large, well-structured datasets.
Without first defining your objectives, it's easy to optimize for the wrong criteria — choosing a provider based on the largest dataset, the lowest price, or the longest feature list, rather than the one that's best suited to your specific use case.
Before evaluating vendors, ask yourself:
- What business question am I trying to answer or solve?
- Who will use this data, and how?
- What does success look like?
- Which capabilities are essential and which are nice to have?
Once that answer is clear, evaluating providers becomes much more straightforward. Instead of searching for the "best" mobility data provider, you'll be looking for the provider that's best equipped to help you achieve your goals.
Mistake #2: Assuming All Mobility Data Is Created Equal
Not all mobility data is collected, processed, or delivered in the same way, and those differences can have a meaningful impact on the insights you generate.
Providers may offer:
- Raw location observations
- Processed or modeled datasets
- Aggregated insights
- Specialized products built for specific workflows
None of these approaches is inherently better than another. The right choice depends on what you're trying to accomplish, who will be using the data, and how much flexibility or customization your team requires.
As you evaluate providers, consider questions like:
- How is the data collected and sourced?
- What processing or modeling has been applied?
- How frequently is the data refreshed?
- What quality assurance and validation processes are in place?
- Does the provider offer the data in a format that fits my workflow—whether that's raw data, APIs, or ready-to-use insights?
Understanding these differences will help ensure you're evaluating providers based on what matters most for your business, rather than assuming all mobility data delivers the same value.
Mistake #3: Confusing More Data with Better Data
Bigger is not always better. A larger dataset isn't valuable if it lacks the precision, consistency, or quality required for your application.
If you're building national audiences, training AI models, or conducting broad market analysis, having a large, representative dataset can be a significant advantage. In these scenarios, greater scale often translates into more robust insights and better statistical confidence.
But there are many cases where simply having more data won't improve your results.
For applications like visitation analysis, site selection, attribution, or localized market intelligence, factors such as precision, consistency, and data quality can be just as important — if not more so — than the total number of devices.
Instead of asking, "Who has the biggest dataset?" consider questions like:
- Is the dataset representative of the population I'm trying to understand?
- Is coverage consistent across the geographies that matter most to me?
- How is data quality monitored and maintained?
- How frequently is the data refreshed?
- Does the provider have the scale my specific use case requires?
The best mobility data provider for you is the one with the right combination of scale, quality, and consistency for your business objectives.
Mistake #4: Treating Privacy as a Checkbox
Privacy has become one of the most important considerations when evaluating mobility data, but it's about much more than checking a compliance box.
As regulations continue to evolve and consumer expectations around data transparency increase, organizations need confidence that the data they're using has been collected and managed responsibly. A provider's approach to privacy doesn't just impact legal compliance—it can also influence data quality, business continuity, and long-term trust.
When evaluating mobility data providers, ask questions such as:
- How is user consent obtained and respected?
- How is data collected and sourced?
- What governance and quality controls are in place?
- How does the provider adapt to changing privacy regulations?
- What processes exist to ensure responsible data stewardship over time?
The strongest providers view privacy as an ongoing commitment. They invest in transparent practices, continuously monitor the evolving regulatory landscape, and build privacy considerations into the way they collect, manage, and deliver data.
Ultimately, a thoughtful approach to privacy benefits everyone. It helps organizations reduce risk, maintain confidence in their data strategy, and build solutions that are sustainable as the industry continues to evolve.
Mistake #5: Assuming There's Only One Way to Access Mobility Data
One of the most overlooked aspects of evaluating a mobility data provider is how you'll actually access and use the data.
Organizations have different technical capabilities, workflows, and business needs. A data science team building custom models has very different requirements than a marketing team looking for audience insights or an analyst exploring visitation trends.
That's why the best providers offer multiple ways to work with their data.
For example, at Veraset, customers can choose the approach that best fits their organization:
- Flat Files for organizations that want direct access to raw data for custom analysis, modeling, and integration into their own environments.
- APIs for teams that need real-time or on-demand access to mobility data within existing applications and workflows.
- Self-Service Platform for business users who want to explore mobility insights, visualize trends, and answer questions without relying on engineering resources.
No single delivery method is inherently better than another. The right choice depends on your team's technical expertise, your existing technology stack, and the business problems you're trying to solve.
As you evaluate providers, consider questions like:
- Does this provider support the way my team prefers to work?
- Can different teams access the data in the ways they need?
- Will this delivery model scale as our use cases evolve?
- If our needs change, will we have to switch providers or simply use a different product?
The best mobility data partner isn't just one that delivers high-quality data. It's one that can deliver that data in the format that creates the most value for your organization today and as your business grows.
What Great Evaluations Have in Common
Successful buyers don't begin by comparing vendors; they begin by defining success. They ask thoughtful questions about their business objectives, data quality requirements, privacy expectations, and operational workflows before narrowing their list of providers.
That approach consistently leads to stronger partnerships and better business outcomes.
If you're evaluating mobility data providers, we'd be happy to help you think through the process. Whether you're comparing vendors, validating an existing solution, or exploring a new use case, our team can help you ask the right questions before making a decision.
Get in touch to discuss your use case.
.jpg)
H3 and Geohash both help organizations organize and analyze geospatial data, but they take very different approaches. Learn how each system works, the key differences between them, and when to use H3 versus Geohash for location intelligence and mobility analytics.
As geospatial data and mobility intelligence become increasingly important across industries, organizations need scalable ways to organize, analyze, and visualize location data.
That’s where geospatial indexing systems like H3 and Geohash come in.
Both H3 and Geohash are methods for dividing the world into smaller geographic cells that make location data easier to process. These systems are foundational to modern geospatial analytics, powering everything from mobility intelligence and urban planning to logistics, mapping, advertising, and machine learning.
While H3 and Geohash solve similar problems, they work differently and are often optimized for different use cases. Choosing the right approach depends on how geographic data will be stored, queried, and analyzed.
In this article, we’ll break down:
- What H3 and Geohash are
- How they work
- The key differences between them
- When to use each system
- Why H3 has become increasingly popular for mobility and geospatial analytics
What Is a Spatial Index?
Before comparing H3 and Geohash, it’s important to understand the problem they solve.
Geospatial datasets are massive. Modern mobility datasets can contain billions of GPS signals, visits, trips, or movement events spread across the globe. Efficiently storing, querying, aggregating, and analyzing that data requires a way to organize geographic space into manageable units.
A spatial index is a system that divides the earth into smaller cells or grids so geographic coordinates can be grouped together efficiently. Instead of analyzing millions of raw latitude and longitude points individually, systems can aggregate data into spatial cells for:
- Faster queries
- More scalable analytics
- Improved visualization
- Pattern detection
- Spatial joins
- Geographic aggregation
This becomes especially important in mobility intelligence, where organizations analyze movement patterns, visitation trends, trade areas, dwell behavior, and population flows at scale.
What Is Geohash?
Geohash is a geographic encoding system that converts latitude and longitude coordinates into short alphanumeric strings.
Developed in the early 2000s, Geohash works by recursively dividing the world into rectangular grid cells. Each additional character in a Geohash represents a more precise geographic area.
One of Geohash’s biggest advantages is simplicity. Nearby locations often share similar prefixes, making Geohash useful for:
- Database indexing
- Location search
- Basic proximity queries
- Lightweight geospatial applications
Because Geohash outputs compact strings, it became widely adopted in early mapping and location systems. While Geohash is widely used for indexing and search, other frameworks may be better suited for certain analytical and mobility-focused workflows.
What Is H3?
H3 is a hierarchical hexagonal spatial indexing system originally developed by Uber Technologies for large-scale geospatial analysis.
Instead of rectangular cells, H3 divides the world into hexagons. This difference is important. Hexagons provide more consistent adjacency and distance relationships than squares or rectangles, making them useful for:
- Mobility analysis
- Spatial clustering
- Traffic analysis
- Routing
- Catchment modeling
- Movement visualization
- Machine learning applications
H3 is hierarchical, meaning each hexagon can be subdivided into smaller hexagons at increasing resolutions. This allows organizations to analyze data at multiple geographic scales while maintaining consistency across datasets.
Today, H3 is widely used across geospatial engineering, mobility intelligence, transportation, logistics, and urban analytics, particularly where spatial analysis and aggregation are important.
Geohash vs H3: Key Differences
1. Cell Shape
The most obvious difference is the grid shape itself. Geohash uses rectangular cells, while H3 uses hexagonal cells. This matters because rectangular grids create uneven neighbor relationships. Distances between adjacent cells can vary depending on direction, especially near the poles.
Hexagons create more uniform adjacency:
- Each cell has more consistent neighboring relationships
- Distortion is reduced
- Movement modeling becomes more natural
- Spatial smoothing and clustering improve
For mobility and movement analysis, this often produces cleaner and more accurate results.
2. Spatial Consistency
H3 is often preferred for modeling geographic relationships because hexagons can represent movement and proximity patterns more consistently than rectangular grids.
This becomes especially important in:
- Human mobility analysis
- Trade area modeling
- Traffic flow analysis
- Route optimization
- Urban movement studies
Geohash is commonly used for indexing and lookup workflows, while H3 is frequently chosen for movement analysis and other spatial analytics applications.
3. Hierarchical Structure
Both systems support hierarchical indexing, but H3’s hierarchy is specifically optimized for scalable geospatial analysis. Each H3 resolution level nests consistently into larger parent cells, making aggregation and multi-resolution analysis easier.
For example:
- A city-wide mobility analysis may use larger hexagons
- Neighborhood-level analysis may use smaller hexagons
- Both datasets remain compatible within the same indexing framework
This flexibility is one reason H3 has become increasingly common in modern mobility intelligence platforms.
4. Visualization Quality
H3’s hexagonal structure typically creates more visually balanced maps and heatmaps.
Rectangular grids can introduce directional bias or visual artifacts, particularly when aggregating movement patterns.
Hexagons tend to:
- Reduce edge effects
- Improve spatial smoothing
- Produce more natural-looking density visualizations
- Better represent continuous movement patterns
This is particularly valuable when visualizing visitation trends, audience movement, or transportation flows.
5. Performance and Scalability
Both systems are highly scalable, though they were designed with different priorities in mind. Geohash is often used for efficient indexing and search, while H3 was built for large-scale geospatial analysis.
Organizations working with the following often prefer H3 because of its efficient indexing and analytical flexibility:
- Billions of GPS signals
- Real-time movement analysis
- Large mobility datasets
- Distributed geospatial systems
As geospatial datasets continue growing, scalable spatial indexing frameworks are becoming increasingly important for modern data infrastructure.
When Should You Use Geohash?
Geohash may be a strong fit when:
- Simplicity is important
- Lightweight indexing is sufficient
- Applications rely on string-based lookup systems
- Basic geographic search is the primary use case
It remains widely used across:
- Databases
- Mapping systems
- Search applications
- Lightweight geospatial tooling
Reach for Geohash when:
- You need a simple, lightweight way to index and search geographic data
- Your workflows rely on database lookups or proximity searches
- Interoperability and broad ecosystem support are priorities
- You want a straightforward hierarchical structure for location data
When Should You Use H3?
H3 is often better suited for:
- Mobility intelligence
- Human movement analysis
- Spatial modeling
- Large-scale analytics
- Trade area analysis
- Transportation analytics
- Audience intelligence
- Machine learning workflows
- Geospatial visualization
Reach for H3 when:
- You're analyzing movement, visitation, or geographic relationships
- You need to aggregate data across multiple geographic scales
- Visualization quality and spatial consistency are important
- You're working with large-scale analytics or mobility datasets
Because H3 handles adjacency and aggregation more naturally, it has become increasingly common in advanced geospatial and mobility applications.
Why H3 Is Commonly Used in Mobility Analytics
Modern mobility datasets are fundamentally about movement:
- Where people travel
- How populations flow between regions
- How visitation changes over time
- How audiences move through physical space
Analyzing these behaviors requires spatial frameworks that can handle:
- Scale
- Resolution changes
- Proximity relationships
- Clustering
- Geographic aggregation
Because of its approach to aggregation, adjacency, and multi-resolution analysis, H3 has become a popular choice for many mobility intelligence and geospatial analytics workflows.
What we use at Veraset
At Veraset, we use both H3 and Geohash because each serves a different purpose within location data workflows. Rather than viewing one as better than the other, we apply each where it provides the most value.
- Geohash supports efficient indexing, spatial matching, and data delivery workflows.
- H3 is provided alongside movement data to support spatial analysis, aggregation, and mobility use cases.
- Different resolutions are used depending on the level of geographic detail required, from broad regional analysis to highly granular movement patterns.
- Together, H3 and Geohash help balance efficient data processing with flexible geospatial analytics.
Final Thoughts
Both H3 and Geohash are powerful spatial indexing systems, and each has valuable use cases.
Geohash remains a lightweight and effective option for many geographic search and indexing workflows.
But as mobility intelligence, geospatial analytics, and large-scale movement analysis continue to evolve, H3 has emerged as a preferred framework for many modern geospatial applications due to its flexibility, scalability, and spatial consistency.
As organizations increasingly rely on location intelligence to power analytics, decision-making, and operational workflows, understanding the differences between these spatial indexing systems becomes increasingly important.
Whether you're building mobility models, analyzing visitation trends, optimizing logistics, or powering geospatial applications, choosing the right spatial framework can significantly improve how effectively geographic data is organized and analyzed.
.jpg)
Learn how mobile location data is collected, how GPS signals work, the difference between foreground and background collection, and how mobility insights are created.
Mobile location data powers many of the digital experiences people use every day, like navigation apps, weather forecasts and online food ordering.
But despite how common location-enabled applications have become, there’s still significant misunderstanding around how mobile location data is actually collected and used. One of the biggest misconceptions is that mobile devices are continuously tracking and transmitting a perfectly complete “breadcrumb trail” of a person’s movement every second of the day.
In reality, modern mobility data works very differently.
In this article, we’ll explain:
- What is mobile location data
- How mobile location data is collected
- What GPS signals actually represent
- The difference between foreground and background collection
- Why location data is not “always on”
- How raw signals become mobility insights
What Is Mobile Location Data?
Mobile location data refers to geographic signals generated by mobile devices, typically smartphones, when apps or operating systems access location services.
These signals may include:
- GPS coordinates
- Wi-Fi positioning
- Bluetooth proximity
- Cell tower triangulation
- Timestamp data
- Device movement signals
When combined and processed at scale, these signals help organizations understand broader movement patterns, visitation trends, audience behavior, transportation flows, and geographic activity.
Mobility data is used across industries including:
- Advertising and media
- Retail and QSR
- Urban planning
- Transportation
- Research and academia
- Real estate
- Tourism and economic development
How Mobile Devices Generate Location Signals
Location signals are typically generated when a mobile application accesses a device’s location services. Additionally the user has to provide permissions for the application to use their location.
This can happen during activities such as:
- Opening a weather app
- Requesting directions
- Searching nearby businesses
- Using rideshare or delivery apps
- Checking in at locations
- Interacting with map-enabled applications
Importantly, location data collection is generally event-driven and not constant. Mobile devices do not continuously transmit a perfect second-by-second record of movement.
Instead, signals are generated intermittently based on:
- App usage
- Device settings
- Permission settings
- Operating system behavior
- Battery optimization
- Signal availability
This means mobility datasets represent samples of movement activity, not uninterrupted tracking streams.
Foreground vs Background Location Collection
A key concept in understanding mobile location data is the difference between foreground and background collection.
Foreground Collection
Foreground collection occurs when a user is actively interacting with an application.
For example:
- Using a navigation app for directions
- Looking up current temperatures in a weather app
- Searching within a retail app for stores nearby
These interactions often produce higher-frequency and more precise location signals because the app is actively requesting location updates.
Background Collection
Background collection occurs when an app receives permission to access location data while running in the background, beyond the times when an app is opened.
However, even background collection is not continuous or unlimited.
Modern mobile operating systems increasingly restrict:
- Frequency of updates
- Background refresh behavior
- Battery usage
- Permission access
As a result, location data availability varies significantly across devices, apps, and operating environments. This is one reason mobility data should not be interpreted as a complete “always-on” movement record.
Why Mobile Location Data Is Not “Always On”
One of the most common misconceptions about mobility data is the idea that smartphones are constantly transmitting exact user locations every moment of the day.
In reality, location signal generation is highly dependent on:
- User behavior
- App engagement
- Permission settings
- Device operating systems
- Signal availability
- Battery optimization controls
This creates natural gaps between observed signals.
For example:
- A device may generate multiple signals during active navigation
- Then generate very few signals while idle
- Or temporarily stop transmitting location updates altogether
As a result, mobility data is best understood as a series of observed location events — not a perfectly continuous tracking feed. Understanding this distinction is important when analyzing movement behavior, visitation patterns, and geographic trends at scale.
From Raw Signals to Mobility Insights
Raw GPS points alone are not inherently useful. To transform raw signals into actionable mobility intelligence, data providers apply additional processing and analysis.
This may include:
- Filtering noisy or inaccurate signals
- Removing duplicate observations
- Mapping coordinates to points of interest (POIs)
- Identifying visits and dwell behavior
- Aggregating movement patterns
- Applying spatial indexing frameworks
- Validating signal quality
This processing helps convert billions of fragmented location observations into structured datasets that can support analysis and decision-making.
For example, processed mobility data can help organizations understand:
- Store visitation trends
- Trade areas
- Tourism flows
- Audience movement patterns
- Transportation behavior
- Event impact
- Regional activity changes
Why Data Quality Matters
Not all mobility datasets are created equal.
The usefulness of mobility intelligence depends heavily on:
- Signal quality
- Coverage consistency
- Data processing methodologies
- POI accuracy
- Timestamp precision
- Spatial resolution
- Privacy and consent frameworks
High-quality mobility datasets require sophisticated processing pipelines to improve accuracy and reduce noise before analysis occurs.
This is especially important for organizations using mobility data for:
- Research
- Measurement
- Planning
- Audience development
- Modeling
- Operational decision-making
Final Thoughts
Mobile location data has become foundational to modern geospatial analysis and mobility intelligence. Understanding how location data actually works is critical for interpreting it correctly.
Mobile devices do not continuously broadcast perfect movement trails. Instead, mobility datasets are built from intermittent location observations generated through app activity, device behavior, and operating system permissions. Transforming those raw signals into useful mobility intelligence requires significant processing, validation, and geospatial analysis.
As organizations increasingly rely on location intelligence to understand real-world behavior, having a strong understanding of how mobility data is collected, processed, and interpreted becomes increasingly important.
At Veraset, mobility intelligence is built on transforming large-scale location signals into structured, actionable geospatial insights that help organizations better understand movement, visitation, and real-world behavior at scale.

Discover what location data is, how it’s used across industries, and how Veraset ensures it’s handled responsibly and with respect for privacy.
What is location data?
Location data, also known as human mobility data, refers to the information gathered from devices such as smartphones, GPS devices, and Internet of Things (IoT) sensors that can track the geographical location of individuals or objects. This data provides insights into the movement patterns, behaviors, and preferences of individuals in various contexts.
What are use cases of location data?
Different industries leverage mobility data to improve decision making and produce insights.
Real Estate
Location data plays a crucial role in the real estate industry. By analyzing the movement patterns and preferences of individuals, real estate professionals can gain insights into market trends, demand for specific locations, and property values. This information helps them make informed decisions regarding property investments and development projects, ultimately benefiting both buyers and sellers.
Retail
In the retail sector, location data enables businesses to better understand consumer behavior and tailor their marketing strategies accordingly. By analyzing the places individuals visit and the routes they take, retailers can optimize store locations, personalize advertisements, and create targeted promotions. This leads to improved customer experiences and increased sales.
Academic Research
Location data has immense potential for academic research. By examining human mobility patterns, researchers can gain insights into various aspects of society, such as migration patterns and trends, transportation systems, urban planning, and the spread of diseases. This data can contribute to evidence-based decision-making and the development of more efficient and sustainable solutions.
Finance
Location data can also benefit the finance industry. By analyzing the movement patterns and spending behaviors of individuals, financial institutions can enhance fraud detection and prevention measures
Traffic flow and transportation systems
Another compelling use case for location data is optimizing traffic flow. With the help of real-time location data, traffic managers can gain valuable insights into the movement patterns of vehicles on the road.
This data enables them to identify congestion hotspots, determine optimal routes, and implement proactive measures to alleviate traffic congestion. By making data-driven decisions, traffic flow can be streamlined, reducing travel time and enhancing the overall driving experience for commuters.
Location data and intelligence are essential for assessing the demand and usage of both private and public transport systems. By analyzing location data, transportation authorities can identify areas with high demand for public transportation and allocate resources accordingly. This helps in optimizing routes, adjusting schedules, and improving the accessibility and efficiency of public transportation services.
Ultimately, this leads to enhanced commuter experiences, increased ridership, and reduced congestion on the roads.
Advertising
Location data has become invaluable in the world of advertising. Leveraging this data, companies can better understand and target their audiences, leading to more effective marketing campaigns.
One of the most compelling use cases of location data in the advertising industry is targeted advertising. By analyzing location data, marketers can gain insights into consumer behavior and preferences. They can identify where their target audience spends their time and tailor their advertising campaigns accordingly.
For example, a retailer can use location data to display targeted ads to customers when they are near their stores, increasing the chances of attracting them to visit and make a purchase.
Another exciting use case is location-based promotions. With location data, advertisers can create promotions that are specific to certain geographic areas.
For instance, a restaurant chain can send mobile coupons to customers who are in close proximity to their locations, enticing them to come in for a meal. This personalized approach can significantly improve the effectiveness of promotions, as it targets consumers at the right time and place.
Location data also plays a crucial role in measuring the effectiveness of advertising campaigns. Marketers can use this data to gauge the impact of location-targeted campaigns by analyzing footfall and conversion rates in different areas. By understanding which locations perform well and which ones don’t, advertisers can better tailor their message.
How is privacy protected in location data?
As location data becomes increasingly integral to various industries, ensuring the privacy and security of such data is paramount. Here are some recent updates in privacy measures concerning location data:
Consent
- Implementation of stricter consent mechanisms where users have to explicitly agree to share their location data, often through granular consent forms.
- Introduction of just-in-time notices that inform users exactly when the location data is being collected and for what purpose.
- Mandating periodic re-consent, where users are asked to renew their consent to share location data at regular intervals.
Anonymization
- Adoption of advanced anonymization techniques such as differential privacy, which adds noise to datasets to prevent identification of individual records.
- Implementing stricter controls on the storage and sharing of raw location data to minimize the risk of re-identification.
- Usage of pseudonymization to replace identifying fields within data records with artificial identifiers or pseudonyms.
Aggregation
- Increased use of data aggregation, where location data is combined into groups or sets that are large enough to prevent the identification of individuals.
- Setting minimum group sizes for aggregated data to ensure individual data points cannot be isolated.
- Combining location data with other types of data in a way that it cannot be used to identify individual patterns or behaviors.
Safeguarding
- Employing encryption both for data in transit and data at rest to ensure that location data remains secure.
- Regular auditing and monitoring of access to location data to detect and prevent unauthorized access.
- Implementation of data minimization principles, ensuring that only the data that is absolutely necessary is collected.
Opt-out
- Facilitating easier mechanisms for users to opt-out of location data collection, such as intuitive toggles within app settings.
- Providing users with the ability to not only opt-out of current data collection but also to request the deletion of historical location data.
- Increasing transparency by informing users of the implications of opting out and how it might affect their experience with the service.
As the applications of location data continue to expand, it becomes essential to find a balance between leveraging this data for its immense utility and protecting the privacy of individuals. Recent advancements in privacy-preserving techniques such as anonymization and aggregation, coupled with regulatory changes emphasizing consent and opt-out options, have paved the way for a more responsible handling of location data.
Through collective efforts, location data can continue to contribute positively to various sectors while respecting the fundamental human right to privacy.

Explore what geospatial data is, how it’s collected, and why it’s transforming industries from environmental management to business strategy.
Introduction to Geospatial Data
Geospatial data, also known as footfall traffic, location, or just "movement" data, plays a crucial role in our modern world. It encompasses a wide range of information that is tied to specific geographic locations, allowing us to analyze, visualize, and interpret data in a spatial context. From satellite imagery and GPS coordinates to maps and geographic information systems (GIS), geospatial data provides valuable insights into various aspects of our environment, society, and economy.
At its core, geospatial data refers to any data that includes location information. This information can be captured through remote sensing technologies, such as satellites, aerial photography, or ground-based sensors. It can also be obtained through GPS-enabled devices that provide precise positioning data. Additionally, geographic information systems (GIS) allow for the integration, analysis, and visualization of different types of geospatial data to reveal patterns, relationships, and trends.
The importance of geospatial data cannot be overstated. It serves as a foundation for decision-making processes in numerous fields, including environmental management, urban planning, disaster response, business analysis, and healthcare. By understanding the uses and applications of geospatial data, we can harness its power to address complex challenges, make informed decisions, and improve the quality of life for individuals and communities.
Throughout history, humans have relied on spatial information to navigate, explore, and understand the world around them. However, with advancements in technology, the availability and accessibility of geospatial data have increased exponentially.
Today, we have access to vast amounts of data that can be utilized to gain insights and solve complex problems.
In the following sections, we will explore the various sources and collection methods of geospatial data, delve into its wide-ranging applications across different industries, examine the challenges and limitations associated with geospatial data, and discuss the future trends and innovations shaping this field. By the end of this comprehensive blog post, you will have a deep understanding of the uses and potential of geospatial data in our modern society. So, let's dive in and uncover the fascinating world of geospatial data!
Sources and Collection of Geospatial Data
Geospatial data is derived from various sources and collected through different methods, encompassing a wide range of technologies and techniques. These sources and collection methods are essential in obtaining accurate and reliable geospatial data that can be used for analysis, visualization, and decision-making.
Let's explore some of the primary sources and collection methods of geospatial data.
Remote Sensing and Satellite Imagery
Remote sensing is a powerful technology that involves the collection of data from a distance, typically using satellites or aircraft equipped with sensors. Satellite imagery, one of the main outputs of remote sensing, provides a bird's-eye view of the Earth's surface and captures information about its physical properties. This imagery can be used to monitor changes in land cover, assess environmental conditions, and track natural phenomena such as deforestation, urbanization, or wildfires.
Satellite imagery is captured using different types of sensors that detect electromagnetic radiation across various wavelengths. This allows the collection of data in different spectral bands, such as visible, infrared, and microwave. Each spectral band provides unique information about the Earth's surface, enabling scientists and researchers to study specific features or phenomena. For example, infrared imagery can be used to detect vegetation health, while microwave imagery can penetrate cloud cover and provide information about ocean currents.
The applications of remote sensing and satellite imagery are extensive. In agriculture, it can be used for crop monitoring, yield estimation, and disease detection. In environmental management, it helps in monitoring deforestation, assessing water quality, and measuring air pollution. Furthermore, remote sensing plays a crucial role in disaster management, allowing for the rapid assessment of damage after natural disasters and aiding in rescue and relief efforts.
Global Positioning System (GPS)
The Global Positioning System (GPS) is a satellite-based navigation system that provides precise positioning information anywhere on Earth. It relies on a network of satellites orbiting the Earth, along with GPS receivers that can receive signals from these satellites. By triangulating signals from multiple satellites, GPS receivers can determine their exact location, velocity, and time.
GPS technology has revolutionized navigation and positioning, enabling precise mapping and tracking capabilities. It has become an integral part of our daily lives, from using navigation systems in cars to tracking fitness activities on smartphones. In addition to personal use, GPS data plays a significant role in various industries and applications.
For example, in transportation and logistics, GPS is used for route optimization, fleet management, and real-time tracking of vehicles and shipments. In surveying and mapping, GPS receivers are used to collect accurate positioning data for creating detailed maps and conducting land surveys. In construction, GPS is utilized for machine guidance, ensuring accurate excavation, grading, and alignment of structures.
Geographic Information Systems (GIS)
Geographic Information Systems (GIS) are powerful software tools that allow for the collection, integration, analysis, and visualization of geospatial data. GIS combines different types of data, such as maps, satellite imagery, GPS data, and tabular data, to provide a comprehensive view of a specific location or area. It enables spatial analysis, modeling, and decision-making by overlaying and analyzing multiple layers of data.
GIS technology offers numerous advantages in managing and utilizing geospatial data. It allows for the integration of data from various sources, facilitating a holistic understanding of spatial relationships and patterns. GIS can be used to perform complex spatial analyses, such as proximity analysis, spatial interpolation, and network analysis. It also provides powerful visualization tools, allowing users to create maps, charts, and interactive dashboards to communicate spatial information effectively.
The applications of GIS are vast and span across different industries and sectors. In urban planning, GIS is used to analyze population distribution, land use patterns, and infrastructure planning. In environmental management, GIS helps in assessing habitat suitability, identifying conservation areas, and managing natural resources. In business and marketing, GIS aids in site selection, market analysis, and target audience identification.
In conclusion, geospatial data is sourced from remote sensing technologies, satellite imagery, GPS, and GIS. These methods of data collection provide valuable information about the Earth's surface, enabling us to monitor changes, navigate accurately, and make informed decisions. The availability and accessibility of geospatial data continue to expand, opening up new possibilities for analysis and innovation. As we delve deeper into the applications and uses of geospatial data, we will uncover its immense potential in addressing complex challenges and driving positive change in our society.
Applications of Geospatial Data
Geospatial data has a wide range of applications across various industries and sectors. Its ability to provide insights into spatial relationships and patterns makes it an invaluable tool for decision-making, planning, and resource management. Let's explore some of the key applications of geospatial data and how it is transforming different fields.
Environmental Analysis and Natural Resource Management
Geospatial data plays a crucial role in understanding and managing our natural environment. By analyzing spatial data, scientists and researchers can assess the impact of human activities on ecosystems, monitor land use changes, and develop strategies for conservation and sustainable resource management.
Land use planning and conservation are essential applications of geospatial data in environmental analysis. By overlaying data on land cover, land ownership, and ecological significance, decision-makers can identify areas that need protection or restoration. Geospatial analysis helps in determining suitable locations for nature reserves, national parks, or protected areas, ensuring the preservation of biodiversity and ecosystems.
Climate change modeling and monitoring heavily rely on geospatial data. By analyzing historical climate data, satellite imagery, and topographic information, scientists can simulate future climate scenarios and assess the potential impact of climate change on different regions. Geospatial data helps in identifying vulnerable areas, predicting changes in temperature or precipitation, and developing strategies for climate adaptation and mitigation.
Wildlife tracking and habitat mapping are other crucial applications of geospatial data in environmental analysis. By using satellite telemetry, GPS tracking devices, and remote sensing data, researchers can monitor the movement patterns of wildlife species, identify critical habitats, and study migration routes. This information aids in conservation efforts, ensuring the protection of endangered species and the preservation of their habitats.
Urban Planning and Infrastructure Development
Geospatial data plays a vital role in urban planning and the development of infrastructure. By analyzing spatial data, city planners, architects, and engineers can make informed decisions about land use, transportation networks, and the allocation of resources.
One of the key applications of geospatial data in urban planning is urban growth analysis and management. By analyzing historical land use data, satellite imagery, and demographic information, planners can assess the growth patterns of cities, identify areas of urban sprawl, and plan for sustainable urban development. Geospatial data helps in determining suitable locations for residential, commercial, and industrial zones, ensuring efficient land use and minimizing environmental impact.
Transportation planning and traffic management are critical applications of geospatial data in urban areas. By analyzing data on road networks, traffic flow, and population density, transportation planners can optimize the design of transportation infrastructure, improve traffic management systems, and reduce congestion. Geospatial data helps in identifying bottlenecks, analyzing travel patterns, and planning for efficient public transportation systems.
Infrastructure asset management is another important application of geospatial data in urban areas. By using GIS technology, city officials can track the condition and maintenance history of infrastructure assets such as roads, bridges, and utilities. Geospatial data helps in prioritizing maintenance and repair activities, optimizing resource allocation, and ensuring the safety and reliability of critical infrastructure.
Disaster Management and Emergency Response
Geospatial data plays a crucial role in disaster management and emergency response. By providing real-time information about the affected areas and the extent of the damage, geospatial data helps in planning and coordinating rescue and relief efforts.
Risk assessment and mitigation are essential applications of geospatial data in disaster management. By analyzing data on topography, land use, and historical disaster events, experts can identify areas prone to natural hazards such as floods, earthquakes, or wildfires. Geospatial data helps in developing hazard maps, evacuation plans, and early warning systems, minimizing the impact of disasters on human lives and infrastructure.
Emergency planning and preparedness rely on geospatial data to ensure effective response during crises. By integrating data on population distribution, critical infrastructure, and medical facilities, emergency management agencies can identify areas with high vulnerability and plan for resource allocation, evacuation routes, and emergency shelters. Geospatial data helps in coordinating response efforts, optimizing the deployment of emergency personnel, and ensuring timely assistance to affected communities.
Post-disaster recovery and reconstruction heavily rely on geospatial data. By using satellite imagery, aerial surveys, and GIS analysis, decision-makers can assess the extent of the damage, prioritize reconstruction efforts, and plan for resilient infrastructure. Geospatial data helps in identifying areas in need of immediate attention, coordinating relief efforts, and ensuring a smooth transition to the recovery phase.
Business and Market Analysis
Geospatial data provides valuable insights for business and market analysis. By analyzing spatial data, businesses can make informed decisions about site selection, market potential, and supply chain optimization.
Site selection and market potential analysis are important applications of geospatial data in business. By analyzing data on demographics, consumer behavior, and competition, businesses can identify suitable locations for new stores, branches, or facilities. Geospatial data helps in understanding customer preferences, predicting market demand, and maximizing profitability.
Location-based marketing and advertising rely on geospatial data to deliver targeted messages to specific audiences. By utilizing GPS data, mobile apps, and geofencing technologies, businesses can send personalized offers, promotions, and advertisements based on the user's location. Geospatial data helps in reaching the right customers at the right time, increasing customer engagement, and driving sales.
Supply chain optimization and logistics heavily rely on geospatial data. By analyzing data on transportation networks, warehouse locations, and customer demand, businesses can optimize their supply chain operations, reduce transportation costs, and improve delivery efficiency. Geospatial data helps in route optimization, fleet management, and real-time tracking of shipments, ensuring timely delivery and customer satisfaction.
Healthcare and Public Health
Geospatial data plays a significant role in healthcare and public health. By analyzing spatial data, healthcare providers, and policymakers can make informed decisions about resource allocation, disease surveillance, and public health planning.
Disease surveillance and outbreak analysis are essential applications of geospatial data in public health. By analyzing data on disease incidence, population density, and environmental factors, health officials can identify disease hotspots, track the spread of infectious diseases, and develop strategies for containment and prevention. Geospatial data helps in predicting disease outbreaks, mobilizing resources, and implementing targeted interventions.
Health services planning and resource allocation rely on geospatial data. By analyzing data on population distribution, healthcare facilities, and disease prevalence, policymakers can identify areas with limited access to healthcare services and allocate resources accordingly. Geospatial data helps in improving healthcare equity, optimizing the placement of healthcare facilities, and ensuring equal access to quality care.
Environmental health monitoring is another important application of geospatial data in healthcare. By analyzing data on air quality, water contamination, and exposure to environmental hazards, health officials can assess the impact of the environment on human health. Geospatial data helps in identifying areas with high pollution levels, tracing the source of contamination, and implementing measures to protect public health.
Challenges and Limitations of Geospatial Data
While geospatial data offers numerous benefits and applications, it also comes with its fair share of challenges and limitations. Understanding these challenges is vital to ensure the accurate and effective use of geospatial data. Let's explore some of the key challenges and limitations associated with geospatial data.
Data Quality and Accuracy
One of the primary challenges of geospatial data is ensuring its quality and accuracy. Geospatial data is collected from various sources and undergoes multiple processing steps, which can introduce errors and inaccuracies. For example, errors can occur during data acquisition, sensor calibration, or data integration processes. Additionally, geospatial data can be subject to positional errors, resolution limitations, and data gaps.
To address these challenges, data quality assessment methods and quality control measures are crucial. These methods involve evaluating the accuracy, precision, and completeness of geospatial data. Techniques such as ground truthing, error propagation analysis, and statistical analysis can help identify and mitigate errors. Furthermore, establishing data standards and best practices for data collection, management, and sharing can enhance the overall quality and reliability of geospatial data.
Privacy and Ethical Considerations
Geospatial data often contains sensitive information about individuals, properties, or critical infrastructure. As such, privacy concerns and ethical considerations arise when working with geospatial data. The spatial nature of the data can potentially reveal personal details and compromise privacy rights if not handled appropriately.
To address privacy concerns, data anonymization techniques can be employed to protect individual identities while still allowing for meaningful analysis. Additionally, adherence to legal and ethical frameworks, such as data protection regulations and guidelines, is crucial when handling geospatial data. Organizations must ensure that proper consent, data sharing agreements, and data security measures are in place to protect the privacy of individuals and prevent unauthorized access or misuse of geospatial data.
Technical Limitations and Infrastructure Requirements
The effective use of geospatial data often requires advanced technical capabilities and infrastructure. Processing and analyzing large volumes of data can pose challenges in terms of computational power, storage capacity, and data processing speed. Furthermore, the availability and accessibility of geospatial data can be limited in certain regions or for specific applications, which can hinder its widespread use.
To overcome technical limitations, organizations need to invest in robust hardware and software systems capable of handling geospatial data processing and analysis. Cloud computing and distributed computing technologies can also provide scalable solutions for managing large datasets. Additionally, efforts should be made to improve data sharing infrastructures and promote open data initiatives to enhance the availability and accessibility of geospatial data.
Data Integration and Interoperability
Geospatial data often comes from multiple sources and in different formats, making data integration and interoperability a challenge. Integrating data from diverse sources, such as satellite imagery, GPS data, and GIS datasets, requires overcoming differences in data structures, coordinate systems, and data models. Incompatibilities between data formats and standards can hinder data sharing and collaboration, limiting the potential insights that can be derived from geospatial data.
To address these challenges, the development and adoption of interoperability standards are essential. Standardized data formats, metadata schemas, and coordinate systems facilitate seamless data integration and interoperability. Additionally, the use of data exchange protocols, such as web services and APIs, allows for efficient transfer and sharing of geospatial data between different systems and applications.
Overall, understanding and addressing the challenges and limitations associated with geospatial data is crucial for maximizing its potential and ensuring its effective use. By investing in data quality assessment, privacy protection measures, technical infrastructure, and interoperability standards, organizations can overcome these challenges and unlock the full value of geospatial data for informed decision-making and problem-solving.
Future Trends and Innovations in Geospatial Data
The field of geospatial data is constantly evolving, driven by advancements in technology and new innovations. Emerging trends and developments are shaping the future of geospatial data, expanding its capabilities and opening up new possibilities for analysis, visualization, and decision-making. Let's explore some of the exciting trends and innovations that are transforming the field of geospatial data.
Big Data and Artificial Intelligence
The increasing availability and volume of geospatial data have paved the way for the integration of big data analytics and artificial intelligence (AI) techniques. Big data refers to large and complex datasets that cannot be easily managed or analyzed using traditional methods. By harnessing the power of big data analytics, geospatial data can be processed and analyzed to extract valuable insights and patterns.
AI techniques, such as machine learning and deep learning, are being applied to geospatial data to automate analysis and decision-making processes. Machine learning algorithms can learn from historical geospatial data and make predictions or classifications based on patterns and trends. For example, machine learning algorithms can be trained to identify land cover types from satellite imagery or predict disease outbreaks based on environmental factors.
The combination of big data analytics and AI enables more efficient and accurate analysis of geospatial data. It allows for real-time monitoring, predictive modeling, and automated data processing. By leveraging these technologies, organizations can uncover hidden patterns, gain deeper insights, and make data-driven decisions in a timely manner.
Internet of Things (IoT) and Sensor Networks
The Internet of Things (IoT) and sensor networks are revolutionizing the collection and utilization of geospatial data. IoT refers to the network of interconnected devices that can collect, transmit, and exchange data. When integrated with geospatial data, IoT devices and sensor networks provide real-time and continuous data streams, enabling dynamic analysis and decision-making.
IoT devices equipped with sensors, such as weather sensors, air quality monitors, or traffic sensors, can provide valuable geospatial data for various applications. For example, by analyzing data from IoT weather sensors, organizations can improve weather forecasting models, assess the impact of weather conditions on crop yields, or optimize energy consumption based on real-time climate data.
Sensor networks, consisting of multiple sensors deployed in a specific area, can provide detailed and comprehensive geospatial data. For example, a network of sensors embedded in a smart city can monitor various parameters such as temperature, humidity, noise levels, or traffic flow. This data can be used for urban planning, infrastructure management, and resource allocation.
The integration of geospatial data with IoT and sensor networks enables a deeper understanding of the environment, real-time monitoring of assets, and the ability to respond to events more effectively. As the number of IoT devices and sensor networks continues to grow, the amount of geospatial data available for analysis and decision-making will increase exponentially.
Augmented Reality (AR) and Virtual Reality (VR)
Augmented Reality (AR) and Virtual Reality (VR) technologies are transforming the way we interact with geospatial data. AR overlays digital information onto the real-world environment, while VR creates immersive virtual environments. When applied to geospatial data, AR and VR technologies enhance visualization, analysis, and communication of spatial information.
AR and VR technologies provide new ways of visualizing and interacting with geospatial data. For example, using AR glasses or mobile devices, users can view real-time data overlays on top of their physical surroundings, enhancing situational awareness. This can be particularly useful in navigation, urban planning, or disaster response, where real-time information is crucial.
In the field of education and training, VR can create immersive virtual environments that allow users to explore and interact with geospatial data. For example, VR simulations can provide a realistic experience of flying over a landscape or navigating through a city, enabling students and professionals to practice and develop spatial analysis skills.
AR and VR technologies also have the potential to improve collaboration and communication of geospatial data. By creating shared virtual environments, multiple users can interact with and manipulate geospatial data simultaneously, enabling collaborative decision-making and problem-solving.
As AR and VR technologies continue to advance, their integration with geospatial data will provide new and exciting opportunities for data visualization, analysis, and communication.
In conclusion, the future of geospatial data is full of promise and innovation. Big data analytics and AI techniques will enable more efficient and accurate analysis, while IoT and sensor networks will provide real-time and continuous data streams. AR and VR technologies will enhance data visualization and interaction. These trends and innovations will undoubtedly shape the way we collect, analyze, and utilize geospatial data, leading to more informed decisions, improved planning, and a better understanding of our world.
Conclusion
Geospatial data is a powerful tool that provides valuable insights into our world. From remote sensing and satellite imagery to GPS and GIS, geospatial data enables us to understand spatial relationships, analyze patterns, and make informed decisions across various domains. Throughout this blog post, we have explored the uses and applications of geospatial data in environmental analysis, urban planning, disaster management, business analysis, healthcare, and more.
We have discussed the importance of data quality and accuracy in geospatial data, highlighting the need for quality assessment and control measures to ensure reliable results. Privacy and ethical considerations have also been addressed, emphasizing the importance of protecting individual privacy and adhering to legal and ethical frameworks when handling geospatial data.
We have examined the technical limitations and infrastructure requirements associated with geospatial data, emphasizing the need for robust hardware, software, and data sharing infrastructures to maximize the potential of geospatial data. Additionally, we have explored the challenges of data integration and interoperability, emphasizing the importance of standardization and compatibility to enable seamless data sharing and collaboration.
Looking towards the future, we have discussed the emerging trends and innovations in geospatial data. Big data analytics and AI techniques are transforming the analysis and decision-making processes, while IoT and sensor networks are providing real-time and continuous data streams. AR and VR technologies are enhancing data visualization and interaction, opening up new possibilities for collaboration and communication.
Geospatial data is a valuable resource that empowers us to understand our world, solve complex problems, and make informed decisions. As technology continues to advance and new innovations emerge, the potential of geospatial data will only expand further. By harnessing the power of geospatial data and staying abreast of the latest trends and developments, we can unlock its full potential and create a better future for all.

Spot key red flags when evaluating data suppliers and choose partners you can trust.
Have you encountered these red flags during a data evaluation?
In the past year, we've seen an increase in data suppliers:
- serving replay data from previous event dates
- licensing data they don't have the rights to
- manipulating data to make it seem more unique
- manipulating data to make it seem like there are more pings per device
Here are some warning signs to watch out for when you evaluate data for your organization.
Cherry-picking data samples
Be wary of vendors who provide a hand-picked, overly positive representation of their data set for evaluation.
This is the easiest way to misrepresent overall data quality.
What to do: Ask for a specific week of data or a live feed. Specific samples can provide a signal that the evaluation data set is a fair and accurate representation of the vendor's actual data offering.
If you can’t get a specific sample, then you should at least get a solid explanation as to why not.
Overemphasis on proprietary methodologies
Some vendors talk about proprietary methods and algorithms that allegedly enhance data quality and accuracy.
Usually, they consist of anomaly detection, deduplication of records, and a few other cleansing tactics.
But these aren’t proprietary methods. They’re industry norms.
What to do: Be wary of companies who try to sell you on a patented process. It's usually just cover for avoiding transparency around processes.
Vendors should be able to provide clear, straightforward explanations of their techniques and willing to answer your questions.
Going dark during anomalies or industry events
In data, anomalies happen. They’re a feature of the landscape and sometimes make up the very landscape themselves. Vendors may attempt to disregard inconsistencies or irregularities during the evaluation process.
Your data team will likely be on the lookout for patterns of missing or suspicious values. Can the vendor provide a reasonable explanation for these occurrences?
What to do: Ask your vendor about their track record of client communication during industry events. How do they handle supply changes? What teams and systems do they have in place when you need understanding around a policy change that affects data quantity or quality?
Again, it's not about downplaying the fact that anomalies arise or industry-changing events happen; it's about understanding how a partner responds during those uncertain times.
Exaggerated precision claims
Some vendors might claim unrealistic levels of precision for their location data, even though true precision may vary depending on factors such as GPS signal quality or data source.
What to do: Ask vendors to explain how they measure precision and what variables can affect it. Request a precision metric sample for their data and, if possible, verify it against independent benchmarks.
It's also a good idea to inquire how they handle situations where precision may be lower, such as in areas with poor GPS signal quality or data sourced from less precise methods.
The main takeaway: Ask hard questions.
Like any other relationship, a strong data partnership begins with transparency, honesty, and open communication.
A worthy partner will appreciate your diligence and provide clear, satisfactory answers to your questions, even if that sometimes means saying, “I don’t know.”
Keep these red flags in mind as you navigate your options, and never settle for less reliable data than your project deserves.

What Our Partners Say
Hear from organizations building with Veraset data.
“Partnering with Veraset has elevated our ability to deliver highly effective, data-driven campaigns. They’re not just a data provider, they’re a strategic partner that has helped us deliver better outcomes for our clients.”

Put Our Data to the Test
Request a demo or start an evaluation today.
